

The gig economy's quiet second job: a shock absorber for households
 Economics Team
Authors: Vikram Bahure and Ben Savours
A New Safety Net: Gig Work as Insurance Against Hard Times
For many households, gig economy work serves as a safety net during difficult economic times, there when household finances come under strain, whether from a job loss or when earnings fail to keep pace with the rising cost of living.
Public First has conducted numerous surveys with gig economy workers over the past eight years, and this is a theme that comes through consistently. In markets all over the world, workers describe this kind of work as a source of support during lean periods, whether to replace lost income or to supplement it when money is tight.
We wanted to test whether this story holds up at a macro level. Specifically, we looked at the relationship between macroeconomic factors linked to household financial security and growth in the number of gig economy workers. We examined three variables, household consumption, unemployment and inflation, against our dependent variable, the number of gig workers in the economy, using data from three markets (the US, UK and Canada) and a VAR model specification. We explain the method in the appendix. We present our results in this short blog.
What the polling shows
What gig-workers think
The story workers tell begins with emergencies. When a sudden expense lands, or a job disappears, app-based work is income that can be switched on within days rather than weeks. That flexibility is the draw: in the UK, 89% of drivers rated it the single most important reason they take up the work.1 And it pays off when it is needed most. In the US, 76% of rideshare and delivery workers said the work had helped them make money in an emergency, and half said it had bridged the gap between losing one job and finding another.2
The second story is slower, but just as widespread: the steady grind of a rising cost of living. The past five years have brought the sharpest squeeze on household budgets in a generation. In the UK, real household income per person fell by 1.9% in 2022-23, the largest single-year drop since records began in 1956 (OBR / ONS, 2023), as CPI inflation peaked at 11.1% in October 2022 (ONS). Against that backdrop, app work has become a way to make ends meet. In our US surveys, between 63% and 65% of drivers said the income had helped cover their rising costs. And in Canada, our work found half of drivers and couriers would have struggled to cover their costs without app-based work. Across the markets we have polled, when prices outrun wages, people top up through the apps.3
How the public views gig work
The wider public sees it the same way. In our poll of the US general public, 23% say they would consider gig work if they needed extra income, about level with taking on overtime (21%) or a second job (20%).4 And this only rises with need: among people under the most cost-of-living pressure, 26% would consider it, against just 14% of those under none. This is stated willingness rather than a firm plan, but it shows gig work is now a mainstream fallback in people's minds, a finding backed up by contemporary academic literature (Mas and Pallais, 2017; Jackson, 2019; Koustas, 2018).
What the macro data shows
The first hypothesis we wanted to test was that the gig workforce grows when consumer demand falls. If true, what might explain this? Because the two are driven by the same thing. When households come under financial pressure they spend less, which shows up in the data as a fall in consumer demand. That same pressure is what pushes people toward gig work to make up the shortfall. A fall in consumer spending is, in other words, a marker of household strain, and it is that strain the gig workforce responds to.5
The data bear this out. A one-standard-deviation fall in consumer demand is associated with a rise in platform-workforce growth of about one percentage point in the same year, building to a peak of roughly five percentage points a year later, before fading to zero by year four. The response is largely immediate, consistent with people cutting their spending and picking up gig work at much the same time, and it keeps building over the following year. Adding those yearly gains together, that single fall in demand (albeit a very large fall) leaves the gig workforce around 8% larger than it would otherwise have been, a lasting increase in its size rather than a one-year blip. And the relationship is statistically robust: consumer demand reliably predicts platform-workforce growth (Granger p = 0.008), and the direction holds in every version of the model, from the US alone up to the full three-country pool.
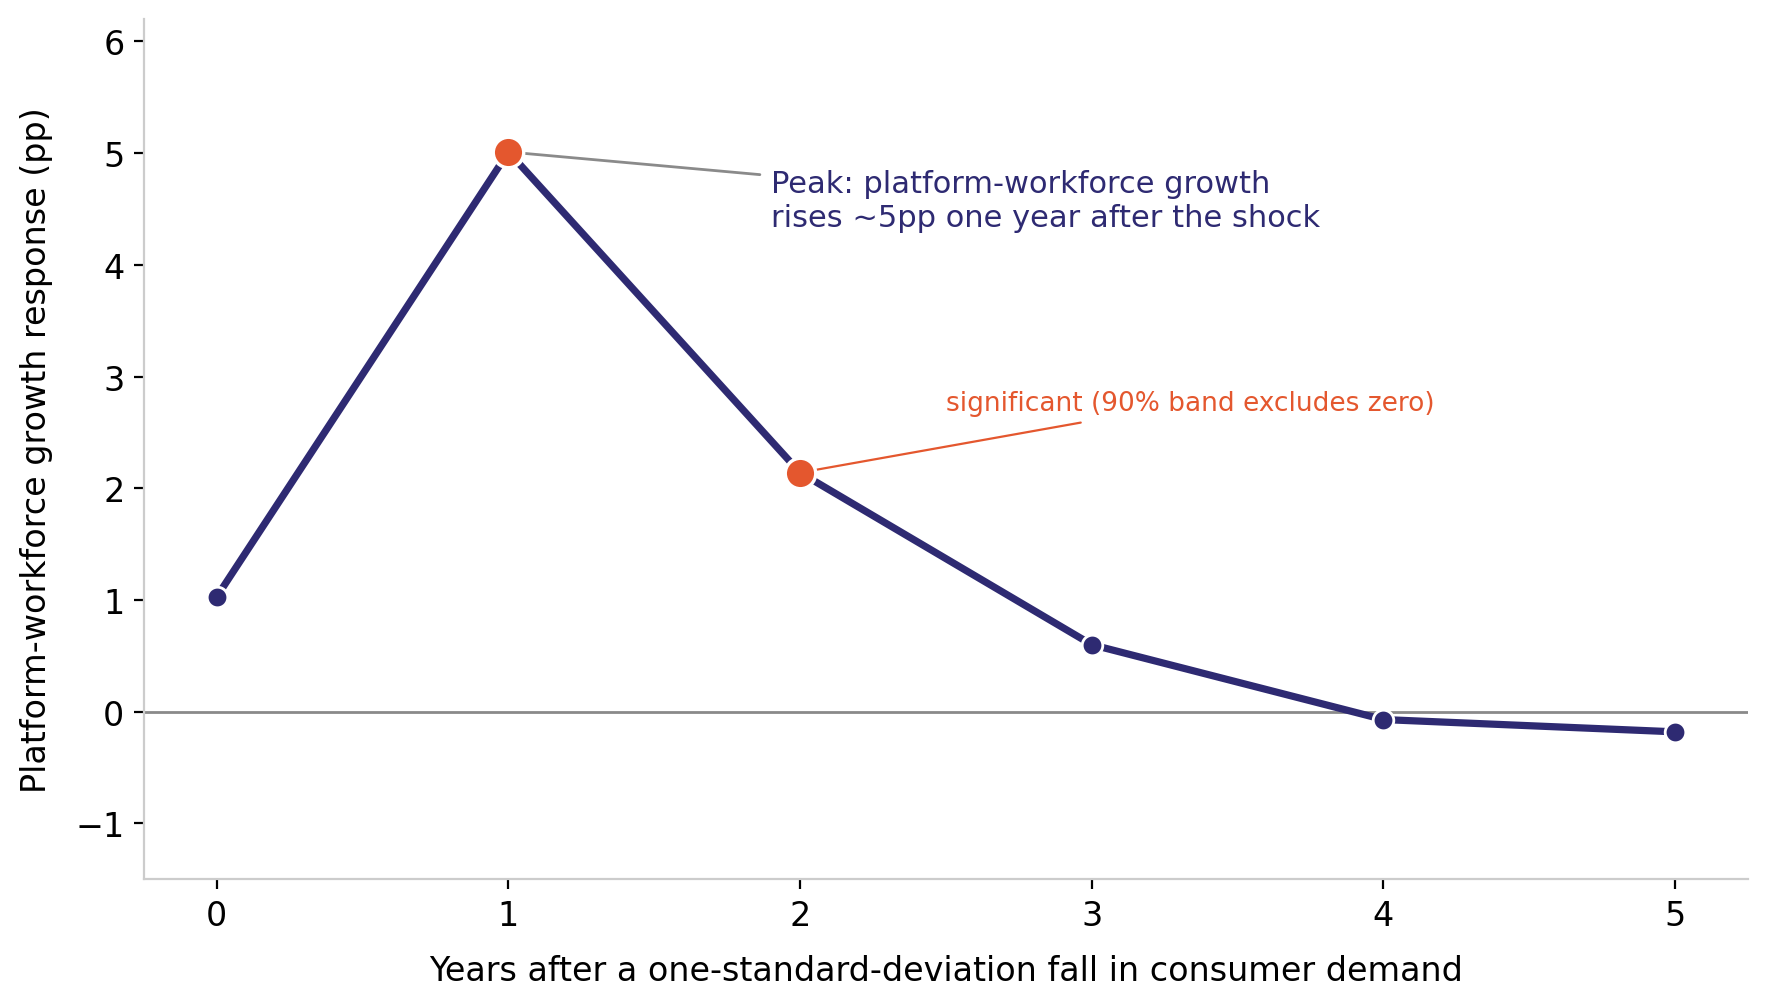
Notes: Response of platform-workforce growth (percentage points) to a one-standard-deviation fall in consumer spending. The orange markers are years whose response is statistically different from zero (90% confidence). Source: Public First analysis of official statistics (US BLS, UK ONS, Statistics Canada, via FRED). Three-country pooled panel VAR, 2008–2025, 45 country-year observations.
The table below shows the full response path for consumer demand alongside unemployment: how platform-workforce growth responds to a one-standard-deviation rise in each factor.
Table. Response of platform-workforce growth to a one-standard-deviation rise in each factor.
|
h (years) |
Household consumption growth |
Unemployment rate |
|
0 |
−1.03 |
−0.64 |
|
1 |
−5.01 † |
+0.21 |
|
2 |
−2.14 † |
+0.93 |
|
3 |
−0.60 |
+0.32 |
|
4 |
+0.07 |
+0.11 |
|
5 |
+0.18 |
−0.01 |
|
Granger p |
0.008 |
0.635 |
Notes: Figures are the response of platform-workforce growth (percentage points) to a one-standard-deviation rise in each factor. The negative consumption column is the cushion at work: a rise in household consumption is followed by lower gig-workforce growth, so a fall in consumption raises it (the case shown in the chart above). † marks a year whose response is statistically significant (90% confidence). The Granger p row tests whether each factor predicts platform-workforce growth overall. Only consumer demand clears the bar (shown in bold).
Whilst our analysis of unemployment did not reach statistical significance, the pattern in the data is still worth drawing out. A rise in unemployment is followed by a growing gig workforce, but the effect builds more slowly than for consumer demand, peaking in year two rather than year one. The longer delay likely reflects the order in which these things happen: a fall in consumer spending and a pick-up in gig work occur at much the same time, as we saw above, whereas unemployment feeds through more slowly, as people work through their savings and their job search before turning to the apps. Inflation, the third factor, showed no reliable relationship in either direction. Both would need a closer study, but neither yet supports a firm claim.
What it means
Whilst the sample for the VAR analysis is relatively small, we think the results, taken together with the polling, show that gig work plays an important role for many households. It is acting as a security blanket for households, and not in one country but across the markets we have studied. When money gets tight, people lean on gig work to help them out.
A larger question follows. If gig work cushions households, does it also cushion the economy as a whole, softening the blow of a downturn? That is perhaps a trickier question, and open for further probe.
References
Public First gig-workforce research
-
Public First / Flex Association. App-Based Work in the United States: Economic Impact Report. flex.publicfirst.co
-
Public First (2024). The Impact of Uber in Canada. publicfirst.co.uk
-
Public First (2023). Uber UK Impact Report. uberuk.publicfirst.co.uk
Academic
-
Jackson, E. (2019). "Availability of the Gig Economy and Long Run Labor Supply Effects for the Unemployed." Working paper (NBER / SSRN).
-
Koustas, D. (2018). "Consumption Insurance and Multiple Jobs: Evidence from Rideshare Drivers." Working paper.
-
Mas, A. and Pallais, A. (2017). "Valuing Alternative Work Arrangements." American Economic Review, 107(12): 3722–3759.
Survey data: Public First weighted polling of US adults (general public) and US rideshare/delivery workers, part of a wider programme of gig-workforce surveys across markets. Macro analysis: Public First panel vector autoregression on official statistics for the US, UK and Canada (2008–2025), sourced via FRED, ONS and Statistics Canada. Full methodology available on request.
Appendix: how we got the macro numbers
Summary of the method behind the macro results.
We used official statistics for the US, UK and Canada, yearly from 2008 to 2025, tracking four series that move together: consumer spending (household consumption), inflation, unemployment, and the gig workforce (taxi, rideshare and delivery). We used these three countries because their data is detailed enough to separate rideshare and delivery from other transport.
DATA
The specific series, mostly accessed via FRED, are:
-
Household consumption (real, year-on-year): BEA real personal consumption expenditure (US, FRED PCEC96); ONS household final consumption expenditure (UK, series ABJR); Statistics Canada real household final consumption expenditure (Canada, FRED NAEXKP02CAA657S).
-
CPI inflation (year-on-year): BLS CPI-U (US, FRED CPIAUCSL); ONS CPI (UK, series D7BT); Statistics Canada CPI (Canada, FRED CANCPIALLMINMEI).
-
Unemployment (rate, annual change): BLS (US, FRED UNRATE); ONS Labour Force Survey (UK, series MGSX); Statistics Canada LFS (Canada, FRED LRHUTTTTCAM156S).
-
Platform workforce (taxi/rideshare and courier/delivery, weighted 30% taxi and 70% courier): BLS employment, NAICS 4853 taxi/rideshare and 492210 couriers (US, FRED IPUIN4853W010000000 and IPUIN492210W200000000); ONS BRES via Nomis, SIC 4932 taxi and 5320 courier (UK); Statistics Canada Table 36-10-0480 (Canada). The 30/70 weight reflects the actual US platform headcount, where delivery makes up roughly 70% of active workers and rideshare 30%, and it is held constant across countries to match the US structure. The US-derived 30/70 is applied to each country's taxi and courier sub-industries, due to no data to estimate for other countries.
METHOD
As these four factors feed back on one another, a simple correlation cannot separate a real signal from coincidence. So we used a vector autoregression (VAR): a small system of equations in which this year's value of each factor depends on last year's value of all four. In outline, the method runs like this:
-
The coefficients. Fitting the system gives a set of numbers measuring the direct impact of last year's factors on this year's values. The key one is negative: a fall in demand feeds into higher platform activity the following year.
-
The shocks. The gap between what the model expected and what actually happened each year is the genuinely new information (an unexpected demand collapse, an inflation spike, a pandemic). These are the real economic shocks we trace through the system.
-
Isolating one shock. Because the shocks tend to arrive together, we use a standard step (a Cholesky decomposition) to separate out a clean, one-at-a-time shock, such as a pure fall in demand. This needs one judgement call: we place the platform workforce last, on the reasoning that it reacts to the wider economy within the year but is too small to move it in return.
-
The response path. We then push a typical-sized shock through the system and roll it forward year by year. The result is the response path in the results table: how platform-workforce growth moves in the years after the shock.
We only treat a channel as a genuine cushion when three checks agree: the response points the right way, it is statistically solid (a confidence band, from re-running the analysis 500 times, that stays clear of zero), and the factor genuinely helps predict platform activity. Two honest limits apply throughout. The samples are small (13 to 16 years per country), so these are indicative cross-country estimates rather than precision figures; and the method shows timing and prediction, not proof of cause.
Footnotes
- The UK polling estimate comes from Public First’s Uber UK impact report.
- The US - Public First 2025 polling.
- The Canada polling estimate comes from Public First’s Uber Canada 2024.
- The US polling estimate comes from Public First’s Flex Association - Economic Impact Report.
- Macro data: household consumption, CPI and unemployment from BEA/BLS (US), ONS (UK) and Statistics Canada, via FRED; platform workforce from BLS (NAICS 4853 + 492210), ONS BRES (SIC 4932 + 5320) and Statistics Canada Table 36-10-0480, weighted 30% taxi / 70% courier.