Energy Bills and Fuel Poverty
-
Words
-
Date
23rd September 2022
-
Social


In January 2022, when the price cap was £1,277, there were around 2 million households in England in “fuel poverty”, defined as spending more than 10 per cent of their household income on energy.
(The UK government used to use this definition for “fuel poverty” and a similar definition is still used in Wales and Scotland, but in England the government now defines “fuel poverty” according to income and the energy efficiency rating. This measure is sometimes referred to as “fuel stress”.)
What has happened since then? The chart below summarises the situation. Effectively, the price cap after the government’s intervention has jumped to £2,100 this winter, and will rise to £2,500 next summer – essentially double the level seen at the start of this year.
What does that mean, in turn, for fuel poverty? The table below shows the difference.
Throughout the last year, we polled cost of living with the public to understand what this meant.
Already by January
- 88% expected the cost of household energy bills to increase
- 17% said they could not afford energy cost increases, regardless of whether other costs go up
- 33% said they could not afford rising energy costs combined with other expected cost increases
By September, the situation was much, much worse
- 23% said they were currently finding it difficult or impossible to afford their energy bills
- 70% of the public said they were taking steps to deal with cost of living increases; 48% said they were cutting back on all non-essential purchases, and 20% eating less
- Half the public now think that the Government is not taking cost of living very seriously (this was before Liz Truss’ various big announcements, to be fair)
Again, to be clear, the level of energy bills in September is lower than they will be in October, even after the huge energy intervention.
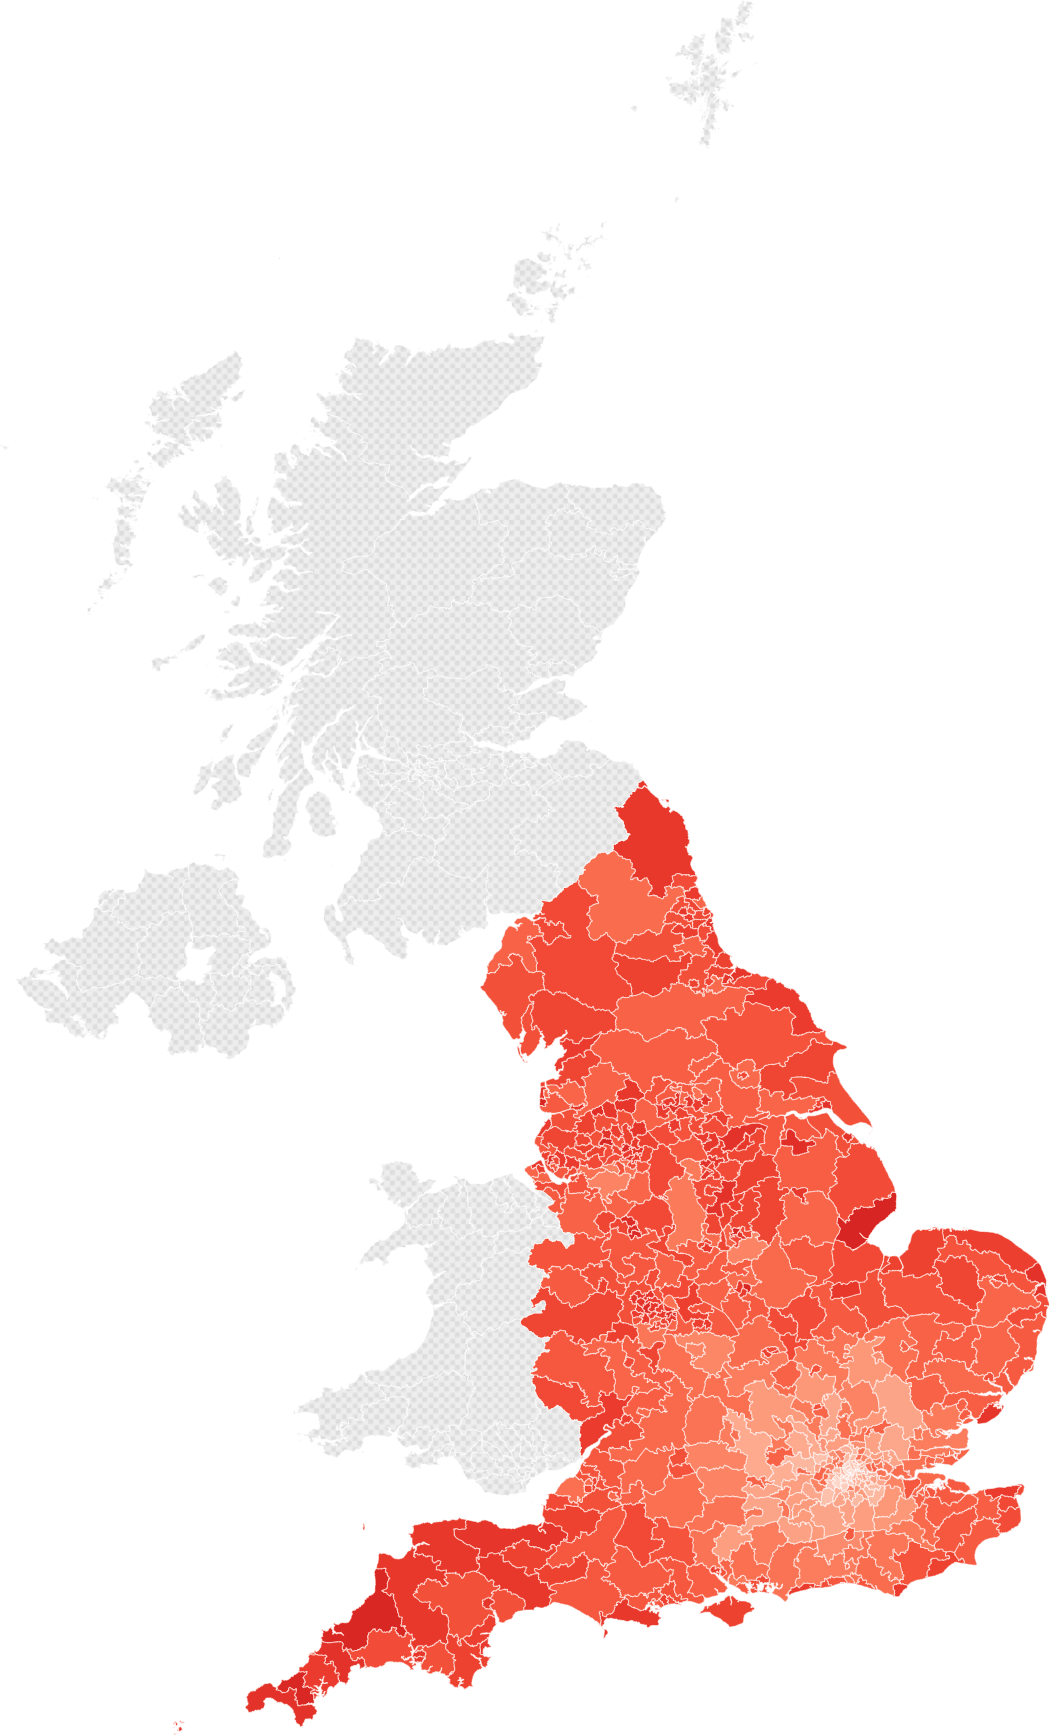
These effects will also be uneven geographically. Fuel poverty is not uniformly distributed across the country. Households in the North of England and the Midlands are more likely to be in fuel poverty than those in London and the South East. Below is a chart of how bad it could have become this autumn…
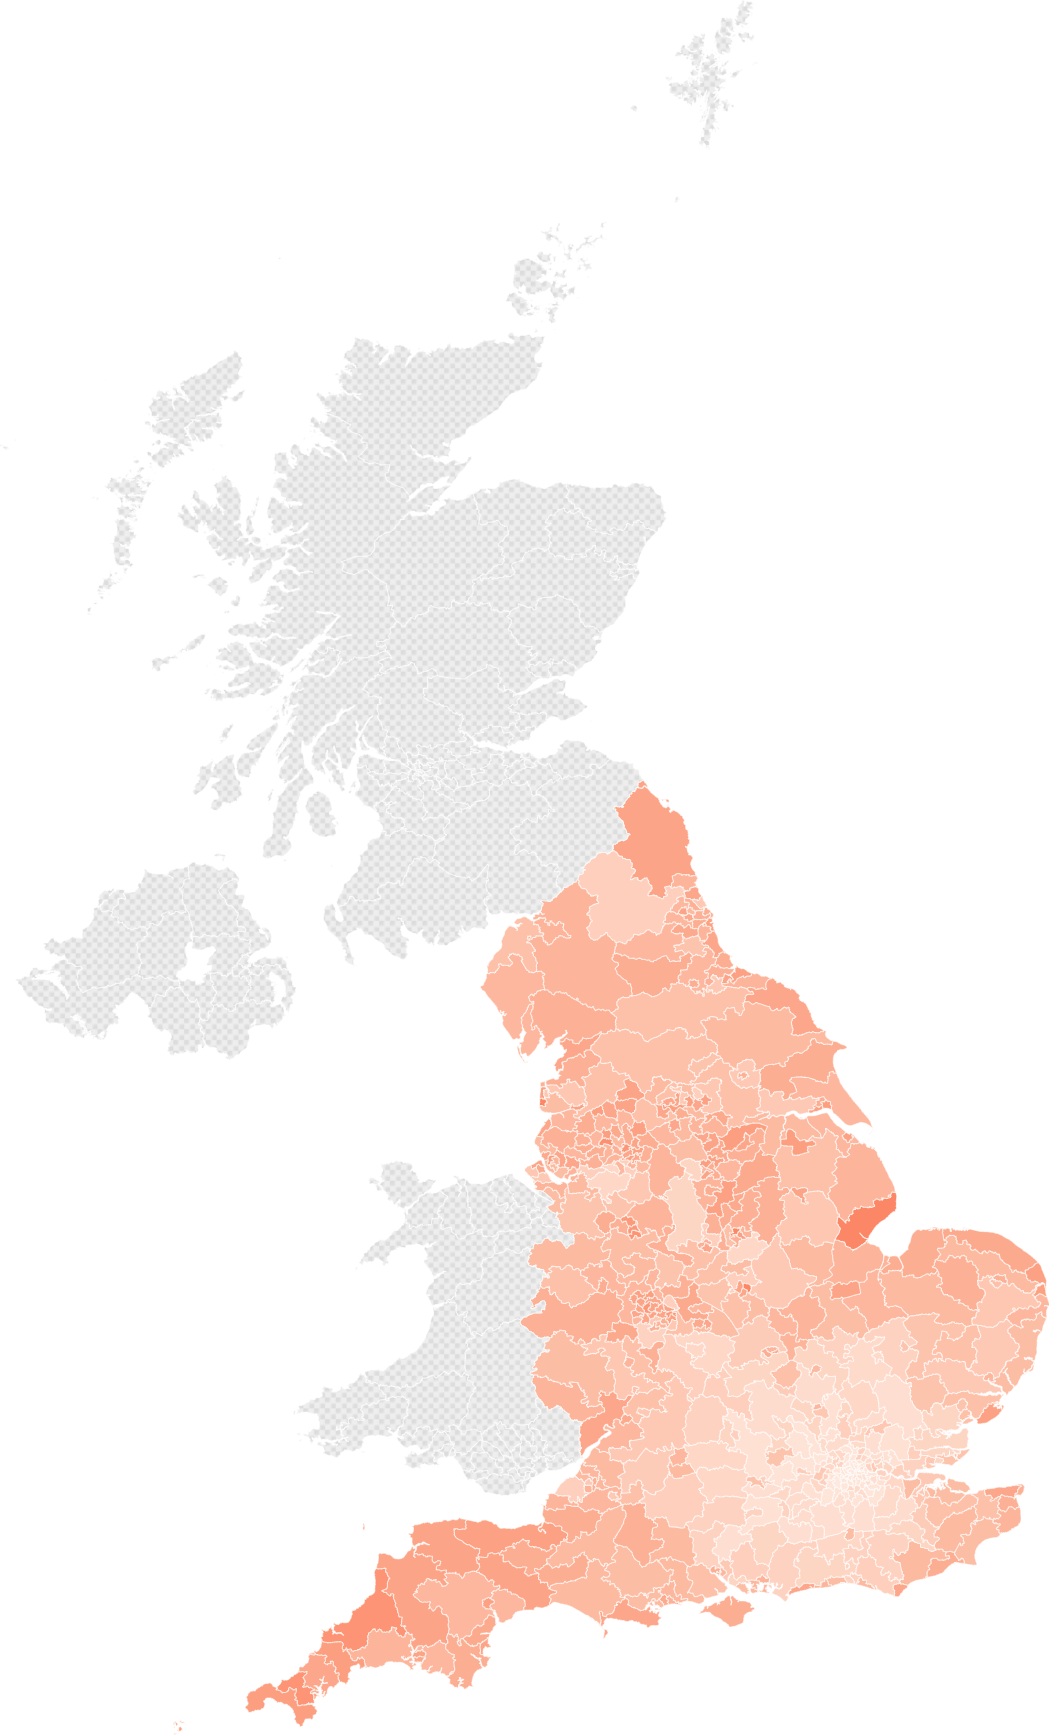
As you’ll see below, fuel poverty levels will be much lower this winter thanks to the enormous government guarantee, but there are still more fuel-poor households in the North, Midlands, and South West.
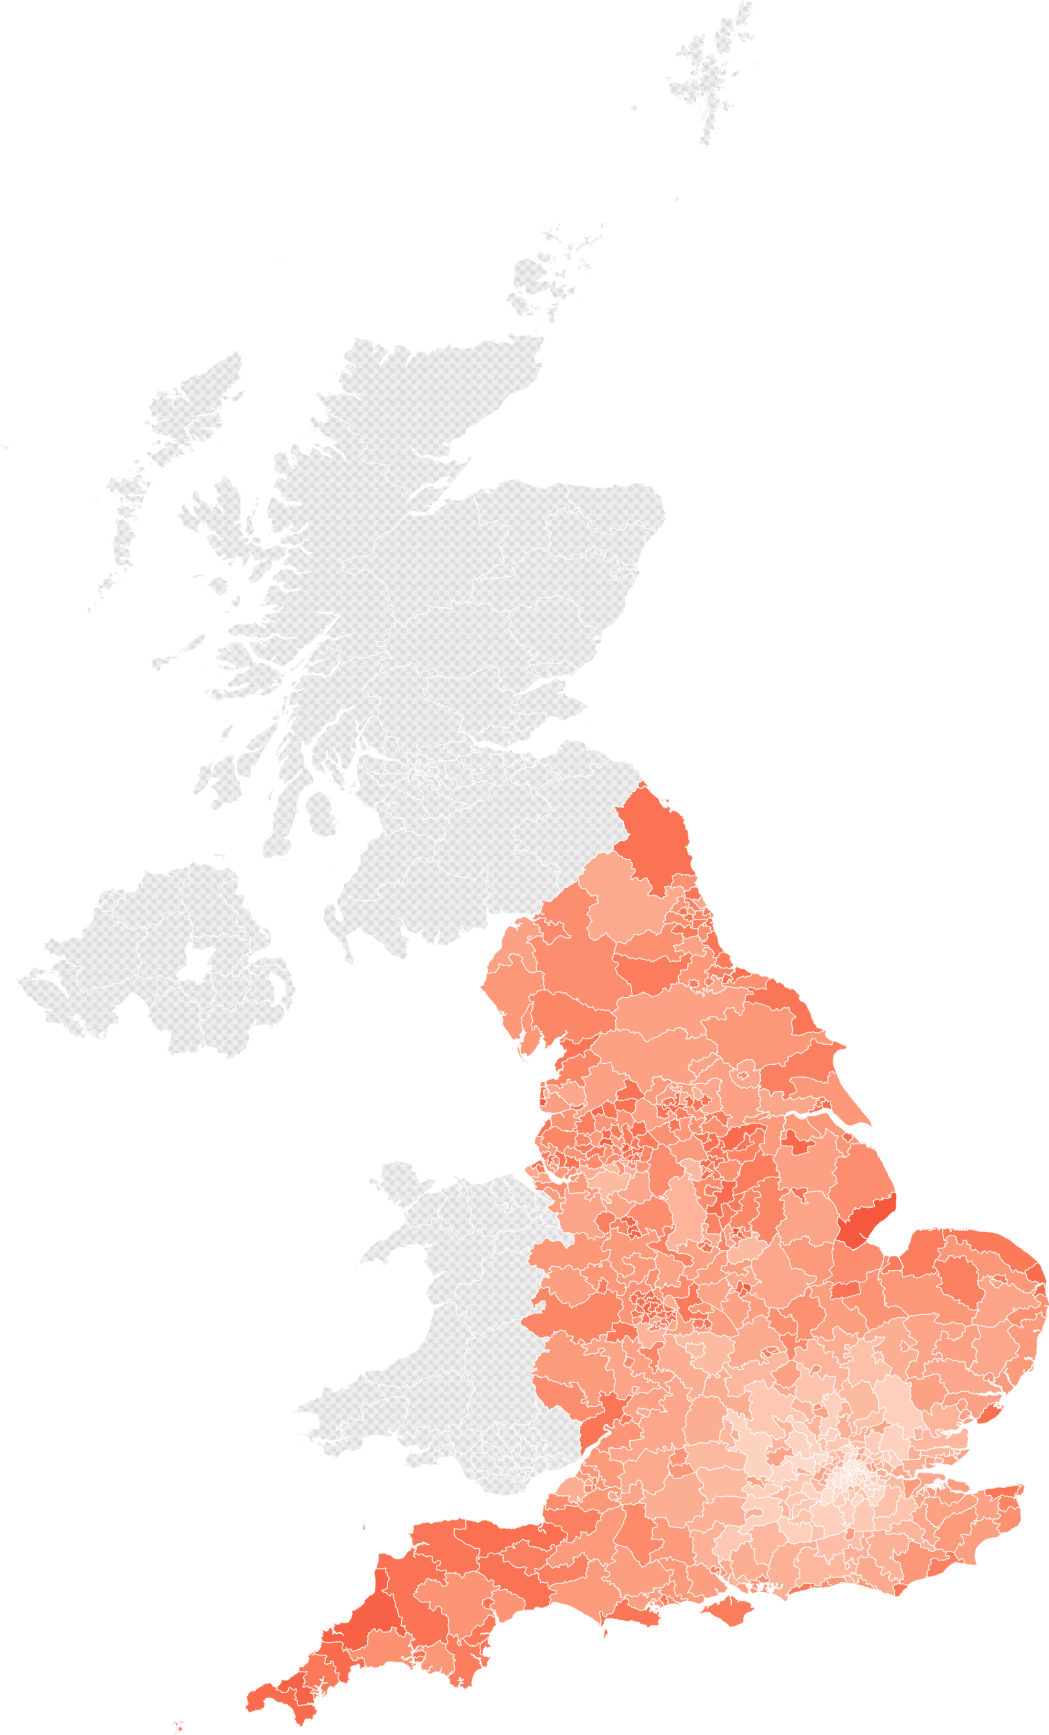
And next summer, it looks pretty bleak again…
What’s our point? That, despite huge government intervention (one that may end up costing significantly more than the furlough scheme did during the pandemic) energy bills over the next two years will be around double the level seen at the start of 2022, with millions of homes struggling to make ends meet.
This matters in the context of the major tax cuts the government just announced, including abolishing the top (additional) rate of income tax. We’ll see how opinion settles in the next few weeks – but it’s important to understand that people in many Conservative seats will still be feeling poorer in the next year.
